Welcome

Get your needs and make your world better!

Enhancing Shopping Center Performance

Written By GIS Portal on Monday, December 5, 2011 | 7:49 PM


 Highlights
  • Business Analyst Online and ArcGIS Mapping for SharePoint help real estate companies create accurate reports for clients.
  • Information once presented in a 300-page binder enhances understanding when aggregated into map form.
  • Real-time models can be built based on market conditions.
The golden rules for creating a successful shopping center—have a good location and strong anchor store—don't always apply in today's retail environment. Instead, the smallest nuances in a market can make or break a business. The success of shopping centers is based on generating the best mix of retailers and creating high-profile developments that are optimally aligned with neighborhood need and market opportunity. Finding and understanding the data to perform these functions in a traditional manner—through spreadsheets and by hand—can be difficult. Many commercial real estate owners and developers are finding that GIS opens the door to a new way of doing business.
SharePoint and ArcGIS Give United Properties an Edge
United Properties agents collaborate online to view information about different shopping center locations using Esri Business Analyst and SharePoint.
One shopping center owner, United Properties, provides a wealth of research to its leasing agents to help them develop critical insights into their trade areas. United Properties, with its sister company and leasing agent NorthMarq, of Minneapolis, Minnesota, is the owner of 20 shopping centers in the midwestern United States, providing a full range of commercial real estate services nationwide.
Too often, however, the agents didn't understand how best to leverage this information. "Giving a 300-page binder of data to our leasing agents just wasn't proving effective," says John Breitinger, vice president of NorthMarq.
The companies partnered with sister company Inetium to develop a program called re-lytics that offers proprietary research, analytics, and a Web-based toolkit supporting both leasing and asset management.
Re-lytics: 15 Minutes to a Great Site
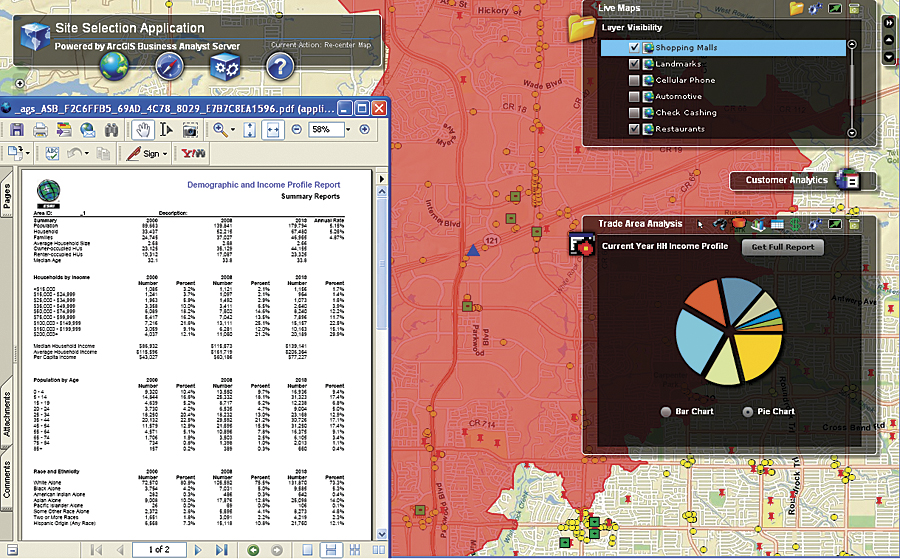
After reviewing several options, the companies chose ArcGIS Server, ArcGIS Mapping for SharePoint, and Business Analyst Online (BAO) API. These were the only solutions they found that would provide access to the geographic datasets, internal information, and assessment tools that agents need to do their jobs, as well as a secure site to collaborate and share information. The team also uses geographic data from ArcGIS.com. With the software and data, leasing agents can now see all the information they need on a map to help their clients find the most appropriate space.
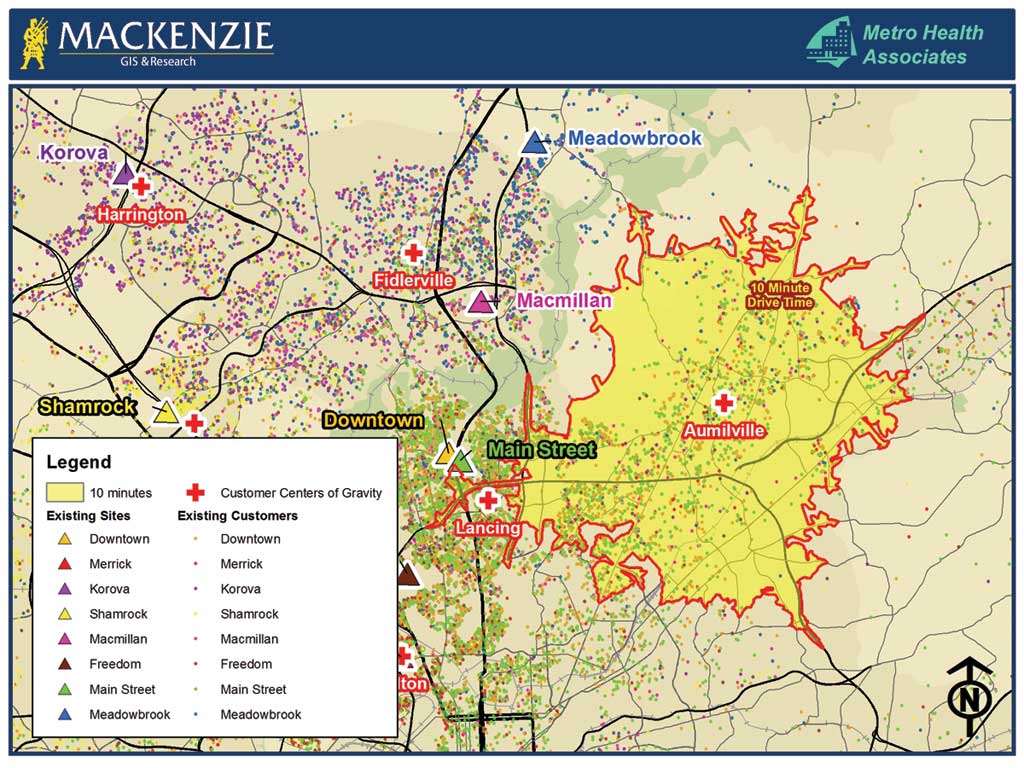
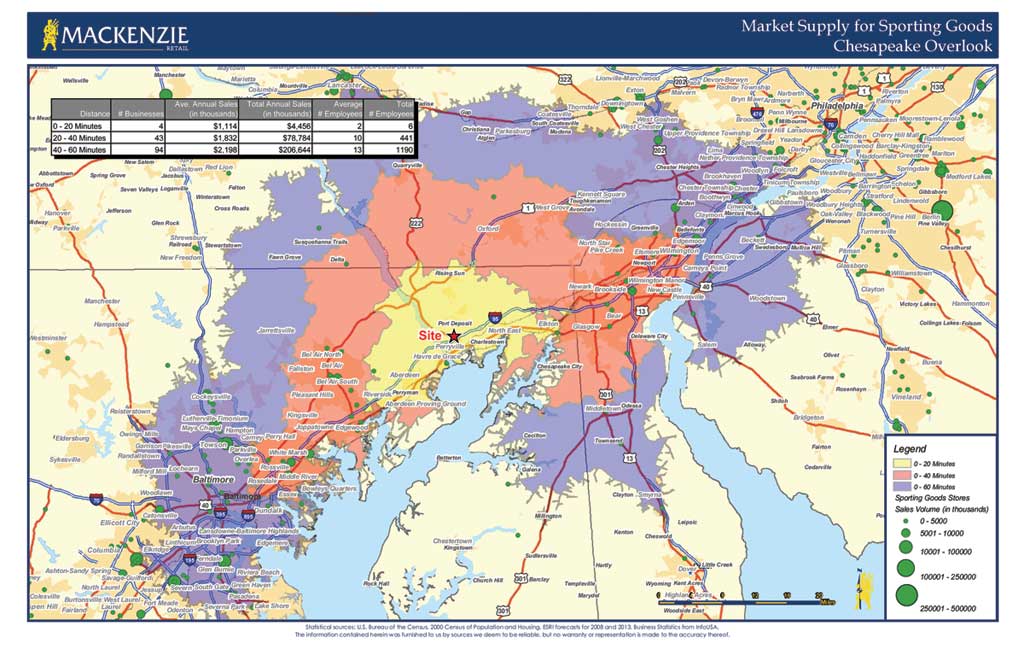
The re-lytics program surveys and assesses more than 134 categories of goods and services in each shopping center trade area. Using ArcGIS, the data can be organized to determine spending potential, competitive dynamics, and consumer preferences for every category of retail goods and services in the marketplace. The program is a quick and simple evidence-based approach since, as Breitinger points out, "Even the best insights are not useful if they aren't easy to use."
One component of re-lytics is a 15-minute tactical analysis. Users employ tools to quickly assess the market potential for a particular business, evaluate existing competition, and create custom marketing materials, including a comparison report that puts everything in context for a prospect. An agent begins by reviewing consumer spending and market potential reports to get a feel for the market potential.
Next, the agent uses the map-based tools to review current competition and property availability and see spatial relationships. The agent makes comparisons by selecting the trade areas to be compared by creating either a custom polygon or a radius or drive-time distance around an address. The agent then selects the categories that need to be considered for that particular retailer, such as key demographics, consumer expenditure, and employment information. A report is generated and made into an Excel spreadsheet. It only takes a few minutes for the agent to add information and a local perspective, such as anchor store and traffic information. A report like this is used to compare a retailer's existing sites to potential sites.
"Working with Esri software, we were able to provide custom materials to support each pitch, including comparison reports and very useful maps," asserts Breitinger. "This was a breakthrough in providing context for every decision. We are all overwhelmed with data. We have found GIS to be a rich platform to aggregate information from many sources and create much better insights and visualizations. This has resulted in more customer engagements and much more substantive discussions."
For more information, contact John Breitinger, vice president of retail services, NorthMarq (e-mail: john.breitinger@northmarq.com).
Nationwide Analysis for Real Estate Transactions
Edens & Avant, headquartered in Columbia, South Carolina, owns, operates, and develops community-oriented shopping centers in primary markets throughout the East Coast. More than 130 centers in 14 states make up its portfolio. The company's clients include regional and national retailers such as Fresh Market, Whole Foods, Publix, Starbucks, and Target.
Creating Healthy Shopping Centers
Whether a retailer is looking to open a new store, add a second store, or move across town, the company has to be ready with the correct information and a strong case for the retailer to move into an existing shopping center or a new development. Purchasing one-off reports to research each shopping center—the company's traditional way of doing business—becomes inefficient when dealing with hundreds of locations that have rapidly changing information like demographic data.
Combining city data with updated information through Bing Maps and Esri demographic data ensures that Edens & Avant has the most current information.
In addition, instead of banking on the promise of growth driven by the housing boom—the standard model a few years ago—developers must now develop projections based on less robust growth and more conservative economic projections. "Healthy shopping centers are the ones that are located in markets with a diverse workforce and good balance of daytime-to-household population," says David Beitz, director of GIS, Edens & Avant. As a result, the company needs to analyze, aggregate, and display accurate demographic information on a daily basis.
Edens & Avant turned to Esri Business Analyst Desktop software and BAO to help its clients make the most informed decisions. Clients can see and understand all information available for each shopping center location, including address, major roads, competition, population density, and growth. BAO is used to generate a customized six-page report annually for each shopping center that is then used by investment leasing and development group agents so they can better visualize and understand their markets. The software helps identify new markets that are similar to those in which the retailers are already successfully operating. If staff members need customized reports or maps, they can request them from the GIS group.
Integration with Bing Maps provides monthly updates to aerial, road, and hybrid (aerial with labels) maps. "Using GIS and Bing Maps, we are able to find locations fast," says Beitz. "Being able to view aerial images allows us to give a better context to our clients about location. This is particularly helpful when looking at larger areas."
Business Analyst streamlines operations. The company looks carefully at optimizing its shopping center portfolio by selling properties in secondary and tertiary markets and buying properties in primary markets with dense populations in core-based statistical areas. GIS is used to look at daytime population and income and population changes, among other information, and to research markets and assist in quickly leasing space by providing spatial information via maps and reports that uniquely characterize neighborhoods and are specific to each retailer.
"It is very important to know the demographics in order to find areas that will perform best in this new economic climate," says Beitz.
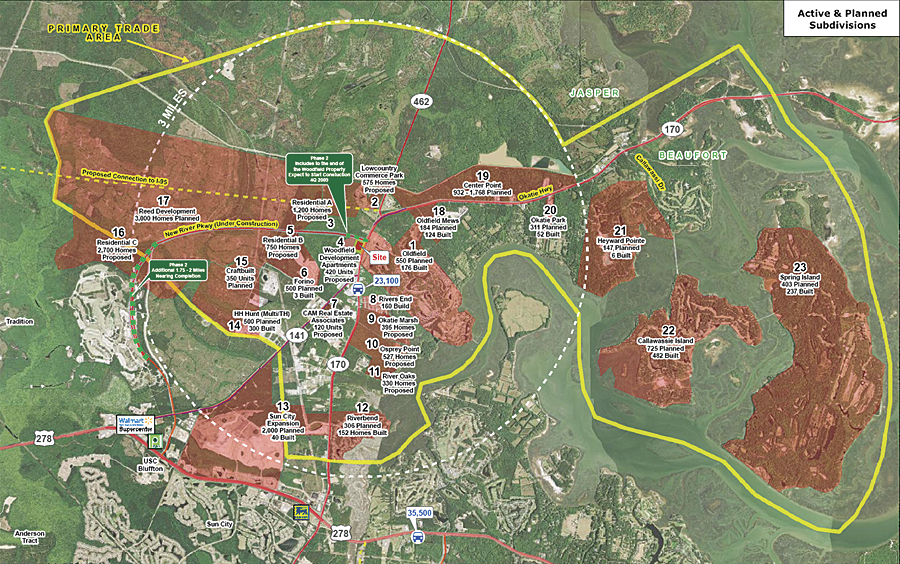
Edens & Avant can now serve its clients' needs internally without outsourcing to third parties. The ability to combine city building permit data ensures that Edens & Avant has the most current information for its clients. As a result, two planned grocery-anchored shopping centers are going forward in areas where population doubled even though residential construction recently slowed down. Being able to find and track this growth with Business Analyst allowed the company to minimize the carry time of the land and provide the shopping center sites based on the retailers' timelines. Concludes Beitz, "Without the information to support these decisions and an accurate and appropriate way to communicate it, these projects wouldn't have been as successful."
For more information, contact David Beitz, director, geographic information systems (e-mail: dbeitz@edensandavant.com).
Friedman Real Estate Group Invests in Analysis
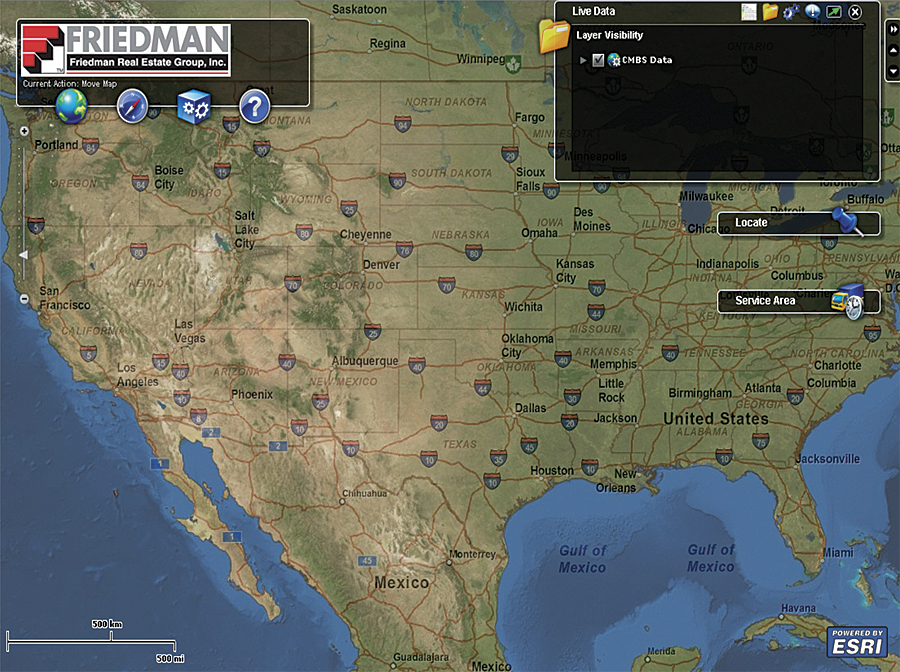
Information is consolidated into one system, llowing Friedman Real Estate Group to better visualize and analyze CMBS data.
Friedman Real Estate Group, of Farmington Hills, Minnesota, a real estate company serving the Midwest, uses a solution based on GIS to help analyze and better organize Commercial Mortgage-Backed Securities (CMBS). Friedman had access to simple mapping tools and data for CMBS loans that allowed it to do analysis on behalf of its clients, but it was unable to do site analysis without a lot of work. Asking a few questions to get a more accurate picture of the investment performance of a particular area or property could take a few days and cost several thousand dollars.
Kirkshire Site Selection Services, a company specializing in technology solutions for Detroit-area real estate businesses, worked with Geographic Information Services, Inc, an Esri partner, to create the solution with ArcGIS Server using an ArcObjects component framework. The new system was created in two weeks.
Says Ian Burnstein, Kirkshire's owner, "The most exciting thing for me was helping Friedman implement a solution that someone with very little technology experience could use. We had to simplify a very complicated procedure so it would be a onetime, up-front expense instead of several thousand dollars each time they asked us to do an analysis."
GeoRSS Gives an Accurate Picture of the Market
Friedman uses a subscription-based service for the CMBS data from Investcap Advisors LLC. Investcap can define its own criteria to create more than 50 data filters, providing Friedman with a way to scrutinize underlying loan and property characteristics. This data is available in a GeoRSS, which is loaded into ArcGIS Server; queried; and segmented by the most relevant criteria for each market situation, such as distressed or performing assets. Analytic real-time models are then built based on market conditions. Dots are created on the map using Adobe Flex and deployed on cross-platform Internet applications based on the Adobe Flash platform using ArcGIS Web Mapping API for Flex. Because different executives want to see different data, they now have the ability to define their own criteria and queries.
In one scenario, the distressed asset group of a real estate firm in Michigan is looking for properties in Florida to represent or broker. A simple query returns all the distressed assets in that state that match the firm's core competencies—for example, retail and multifamily residential units. Displaying these results on a map reveals several clusters of these distressed assets in the Miami area. After choosing the properties of interest, the analyst runs demographic reports of the properties to better understand why there was a failure or a success. Was it due to the general market condition, bad financing, or mismanagement? For a real estate company, understanding these variables can be a key to success.

7:49 PM | 0 comments | Read More

Enhancing the Commercial Real Estate Life Cycle: Using a combination of online and desktop GIS


a heat map GIS combines place with time so brokers can better understand trends in the commercial real estate market. This heat map displays one-year changes in asking rents for the Baltimore market. Bright green areas indicate rising values and dark red areas indicate deep declines.
As a company dealing with buildings and space management, MacKenzie Commercial Real Estate Services has relied on maps to view information for the past 20 years. However, it wasn't until the company incorporated Esri Business Analyst software that MacKenzie's agents really understood their commercial holdings.
Business Analyst and Business Analyst Online (BAO) are now used at the company every day to understand and analyze vast amounts of data. Today, MacKenzie Commercial Real Estate Services uses Business Analyst for all stages of the commercial real estate life cycle at the company, including development, landlord representation, tenant advisory and site selection, market research, construction, and property management. The software has even helped the company offer services to new customers who were not interested in real estate transactions.

Discovering a Digital World

MacKenzie is one of the largest commercial real estate firms in the Baltimore metropolitan area, with more than 140 associates and offices in Annapolis, Baltimore, Bel Air, Lutherville, and Maple Lawn, Maryland. When the company first began using maps to view data, the process was cumbersome and time-consuming. MacKenzie staff would pull aerial photographs off the web, use Adobe Illustrator to plot listings, then draw road and highway labels by hand.
When Matt Felton was hired as the director of research for GIS and mapping, he introduced the company to Esri Business Analyst. Staff now had access to the vast amount of data included with the software such as retail information, consumer expenditure segmentation data, and market potential indexes.
this map reveals customer behavior This map reveals customer behavior that can be used to identify optimal locations for new health care facilities and evaluate the locations of existing sites.
"For the first time, I think members of my company really saw their real estate," Felton said. "We had a lot of fun with the data, viewing and exploring information in a way they hadn't experienced before. The more they saw in the maps, the more questions they would ask."
No stranger to GIS, Felton previously served as a director at Towson University's Center for GIS. The center's staff are GIS consultants to government organizations and private businesses in the mid-Atlantic region. While at the center, Felton worked in many disciplines: homeland security, transportation, economic development, land planning, natural resources protection, public safety, and emergency management.
The one area Felton hadn't experienced was commercial real estate. "I was drawn to the frontier of applying GIS as a common operating picture in a discipline that is inherently location," he said. Felton left Towson and joined MacKenzie right when the economy took a turn for the worse.
"Probably not the best-timed decision," Felton laughed. "But in hindsight, I couldn't have planned it any better. Just when things got really competitive, I had a tool that gave us an enormous advantage."

Gaining a More In-Depth Analysis

Felton heads a team that actively supports about 40 MacKenzie brokers who have mapping and data discovery needs. These needs vary depending on the type of client being served. BAO is used to create quick reports that are often used to investigate data downloaded from real estate information data providers such as CoStar.
When simply exploring a location is important, brokers can use ArcReader to view, discover, and print maps on their own. ArcReader is a free, easy-to-use desktop mapping application from Esri. For more in-depth analysis, Felton's team uses Business Analyst and Esri's Tapestry Segmentation data to characterize neighborhoods for clients.
"Maybe we are working with a company that sells suits," explained Felton. "We can show them where the people who buy suits are located based on the psychographic profile of their customers."
Whether the task is to simply plot a listing or provide a more in-depth analysis of the market, there are replicable steps that every broker follows. First, an area is identified based on available space, high market potential, or other criteria that is important to the client. Once the area is selected, the broker identifies potentially suitable buildings or offices and performs analysis to determine if the site will support the selected criterion or reveals any hidden opportunities.

Timely Data Means Better Decisions

Local information, such as tax maps, are brought into Business Analyst and overlaid on aerial and plat maps for a more accurate, timely view of a location. "Brokers used to spend hours at the courthouse trying to locate the proper tax map," said Felton. "Now—in 15 minutes—a broker can pull up exactly what is needed over the Internet and display it on the desktop."
Combining market areas helped determine if a new site was viable. Combining market areas (20-, 40-, and 60-minute drive times) with business volume data to understand existing market supply for sporting goods and related products helped determine if a large sporting goods store at a new site in Perryville, Maryland, was viable.
This map-centric view of the data allows the agent to click on a property that is of interest and automatically be taken to the state assessor's web page for the property. "This is often much easier than trying to search the online database," explained Felton. "Often, an undeveloped parcel has not been given an address, and our search allows the agent to zoom to the area of interest and click for information."
Once a site has been identified, the agent can explore that area by layering data from hundreds of other layers including zoning, tax incentives, floodplains, nearby businesses, and traffic counts. "GIS enables us to combine Esri's rich collection of data with authoritative data from state and local government organizations and with our own local market intelligence," Felton added.
MacKenzie's brokers can nimbly combine this data to help their clients make more informed and timely decisions. Another advantage? The broker is seen as an expert. "At the same time our brokers are on the phone with a client, they can be finding the property and all the information about it—who owns it, how it is zoned, and how much traffic passes by. They can then create a map layout quickly and e-mail it instantly to the client while still on the phone," said Felton. "GIS enables our agents to be real smooth."

Smooth Operators

Speaking of smooth, Felton has put GIS to use during board meetings and client presentations. Using ArcGIS Explorer, another no-cost viewer from Esri, MacKenzie agents are able to give tours of potential sites—virtually. Agents can instantly narrow down what might be an extensive list of prospects to those that will really pan out.
When a national board of directors was considering relocating its headquarters to a another city, MacKenzie's staff treated the directors to a digital fly-through of each potential site including 360-degree, bird's-eye, and street views of each location. The cost, amenities, and terms for each building were also available and could be queried in ArcGIS Explorer. The directors were able to narrow down their options from 30 to 3 before making the requisite site visit.
"Instead of spending an entire day with a bunch of sweaty people in suits in a van, we were able to narrow down our search sitting comfortably in a conference room and only spend a few hours touring the sites that were really of interest," said Felton. "Time and resources are limited. GIS enables us to do the most with everything we have available to us."

Opening Up New Opportunities

Another application is the company's innovative approach to landlord representation. GeoProspector, a solution the company has created based on Esri's ArcReader and ArcExplorer, helps brokers more effectively search for tenants. GeoProspector combines multiple layers of information, such as streets and office buildings, into an interactive map that is organized by a status grid. Based on the color of the building, brokers can methodically search the grids for potential tenants or buyers, ensuring that they exhaust all possibilities before moving on to another region.
"Instead of going down a long list of prospects, our brokers can work each map area, ensuring that they are effectively canvassing the entire market," said Felton. "GIS has definitely made our company more efficient and has been an invaluable tool for making smarter and faster decisions. We use it on the front end of the process to cull through a lot of data and to help our clients make the best choices possible, then we use GIS on the back end to communicate those choices to stakeholders in a very compelling format."
GIS has also helped MacKenzie branch out and offer new services to clients, even if there is no real estate transaction involved. The company has been assisting a regional hospital with a strategic plan for a new outpatient facility by performing an analysis of the market demand for existing health care, current facilities, number of patients, and other aspects of developing the plan. Using Business Analyst, MacKenzie's staff are able to ask what-if questions and model different scenarios. Would it be better to consolidate existing facilities, relocate those facilities, or open new facilities? Called a GeoStudy service, it is available to any organization.

Informed Decisions, Better Collaboration

Business Analyst and Business Analyst Online are helping MacKenzie integrate the data—property values, location information, zoning data—commercial real estate brokers need to make informed decisions quickly. Integrating this information into one common platform provides a persuasive communication format that enhances collaboration between landlords, tenants, investors, developers, property managers, and brokers.
7:40 PM | 0 comments | Read More

GPS Map of Indonesia v2.15

The Indonesia GPS map file provided in this site is mainly for User's additional reference and should not be used as main map reference/source. It is possible that there will be position deviation or misinformation caused by this map . By download the map from this site User has agreed that any loss, damages or misinformation caused by this map is not the responsibility of the administrator or map developer. User will solely bare all the risk.
User are allowed to use, copy, distribute this map free of charge given the condition that User has agreed with the terms and conditions stated above. Selling, modifying and/or repackaging this map into a different product from what has been provided is strictly prohibited without prior written notification to the owner of navigasi.net.
The file above has been divided into some less size files to ease the lower bandwith internet user. To run the files User has to execute an .EXE extension file which will combining all the files and installing it automatically.
6:41 PM | 0 comments | Read More

GIS Software Resources

GIS Software Packages
Summary of commercial GIS software currently on the market. Find out about the commercial applications available for all operating systems.
Open Source GIS and Freeware GIS Applications
Learn about what open source GIS applications are available.
What is the GeoCloud?
A new term is emerging to describe GIS data and analytical capabilities via cloud computing.
Macintosh Resources for GISResources, software and reviews on the use of GIS and in the Macintosh Operating System.
Software ResourcesCategorized resources for GIS software applications organized by software package. Find datasets, tutorials, code and more specific to Autodesk, ESRI, MapInfo, Intergraph, Grass and other software types.
Software Reviews
Links to articles reviewing software applications and components relating to GIS.
Spatial Database Engines:
Spatial Database Engines help manage spatial data to provide a quicker retrieval of that data from database engines such as Oracle, SQLSever and Informix
Web-based GIS
The latest advances in GIS have come most notably in the forum of the Internet. Access to spatial data over the internet is growing rapidly.
Field GIS
Mobile GIS is a growing technology. More and more choices are becoming available for field spatial data collection. Find field GIS software to fit your PDA or handheld computer.
Component GIS
Component GIS software enable developers to create custom GIS applications. Find resources relating to Component GIS in this category.
Image Analysis
Collection of available software applications for image rectification and manipulation.
Free Data Viewers
Free data viewers for a variety of GIS formats. These viewers allow you to display geographic data as well as perform some basic GIS functions.
4:49 PM | 0 comments | Read More

What is the GeoCloud?

A new geospatial term has been popping up on the Internet lately: the GeoCloud.  Carl Reed, Chief Technology Officer in the July 2008 OGC newsletter (Chief Technology Officer’s Message: The Cloud) defines cloud computing:
The term “cloud” comes from the fact that we have all used the cloud symbol to represent the internet/web. Cloud computing therefore refers to consumers, developers and applications being able to access computing resources from the cloud. These computing resources are typically owned and operated by some third party provider – either for free or for a fee.
Thus, taking the concept one step further, adding Geo denotes that these computing resources have some geospatial aspect to them.  As noted on the ENTCHEV GIS Blog, The Memory Leak blog has a laundry list of GeoCloud computing.

4:43 PM | 0 comments | Read More

Agriculture Pulls All GIS Maps Into A Single Portal

A new web portal being put together by the Agriculture Department aims to reduce duplication in the agency's mapping work and make high-quality maps more accessible to the public.
More than half the department's 29 divisions are involved in geospatial work, Geospatial Information Officer Stephen Lowe said, either mashing satellite and aerial imagery with survey data or on-the-ground research about crop yields, ground chemicals or farm subsidies, or using other divisions' maps in their own research and programs.

USDA-produced maps and images generally are available to the public for free or for a nominal fee, and frequently crop up in paid data services and even in Google Maps, he said.
At the moment, though, there's no central repository for all the department's GIS maps and the largest repository for publicly available maps requires users to fill out a complex order form for specific data before they get a look at the map itself.

The result is USDA researchers and outsiders often don't even know that a map of, say, all the farmers' markets in Kentucky or all the farm subsidies recipients in Arkansas already exists, and they either end up duplicating work that's already been done or relying on an inferior product.
The portal will provide researchers and other Agriculture staff with a better ability to create their own GIS products, Lowe said, by mapping new information onto base maps created elsewhere in the department or by using basic USDA-produced templates.

"This extends mapping capabilities out to economists, policy people, financial people and [human resources] people," he said. "It's sort of a transformation from the lone GIS professional sitting at his desk to really pushing 60 percent to 80 percent of map making out to other disciplines. Then the GIS professional transitions to the role of a strategic adviser and focuses skills on the other 20 percent of policy and program management issues that cause the major headaches."

The new portal, which is hosted in Amazon's public EC2 computer cloud, is already available to a few divisions within Agriculture and will be launched departmentwide in the next couple of months, Lowe said. The site should be available to the public about six to eight months after that.
The Agriculture Department portal was designed by Esri, the geographic information system company that developed the ArcGIS software suite. It was built using a specialized version of Esri's software called Portal for ArcGIS, which gives users more freedom to customize what they produce, said Victoria Kouyoumjian, an Esri information technology strategies architect.

Esri previously worked with the department's Food and Nutrition Service on the Supplemental Nutrition Assistance Program, a geo-locator that pinpoints retailers that accept federal food assistance cards.
Lowe envisions the portal serving as a meeting ground for the department's mapping experts, spread across different divisions, where they can figure out whose maps can be tweaked to save work elsewhere and develop best practices.

The portal also requires each map to carry a collection of metadata, descriptions of when and how the data was gathered that other mappers can use to determine whether the map meets their needs.
The Agriculture Department isn't alone in trying to mix crowdsourcing approaches with GIS technology.
The U.S. Agency for International Development is standing up a Washington-based "geocenter" to assist map-making specialists and nonspecialists at its missions around the globe. The Defense Information Systems Agency launched a portal to pull together GIS maps, rapidly uploaded YouTube videos and Web chats to help aid workers respond to the 2010 Haiti earthquake.

As GIS technology is adopted more broadly, Kouyoumjian said, Esri's portal or similar products could have multiple uses inside government at the federal, state or local level. As one example, she said, state redistricting commissions could use GIS maps to create more dynamic cost-benefit analyses of moving district lines. GIS maps also could be used to analyze the long-term effects of stimulus spending in different states and districts, she said.

Courtesy: http://www.nextgov.com/nextgov/ng_20110817_6767.php?oref=topstory
3:53 PM | 0 comments | Read More